Trend and variability artifacts in W5E5 due to observation gaps in CRU and GPCC #20
issue
Stefan Lange reported on June 27, 2022.
By design, monthly mean precipitation over land in W5E5 v1.0/v2.0 is identical to gauge catch-corrected monthly mean precipitation from the GPCC Full Data Monthly Product v2018/v2020 [1/2]. Similarly, monthly mean near-surface air temperature and the monthly mean diurnal range of near-surface air temperature over land in W5E5 v1.0/v2.0 are identical to the corresponding CRU TS v4.03/v4.04 [3] values. This is because W5E5 is a bias-adjusted version of ERA5 [4], where the bias adjustment is done at the monthly time scale using GPCC and CRU [5,6].
Both GPCC and CRU are interpolated station datasets without any gap, despite the existence of gaps in the observational records they are based on. This is achieved by infilling, which means that for the production of those gridded datasets, gaps in station observations are filled using local climatologies. If such gaps persist for years, this has an impact on interannual variability and trends in GPCC and CRU. Those are then unrealistically low in magnitude. The problem is inherited by W5E5. Strong examples and world maps that show the extent of the problem are presented in the following.
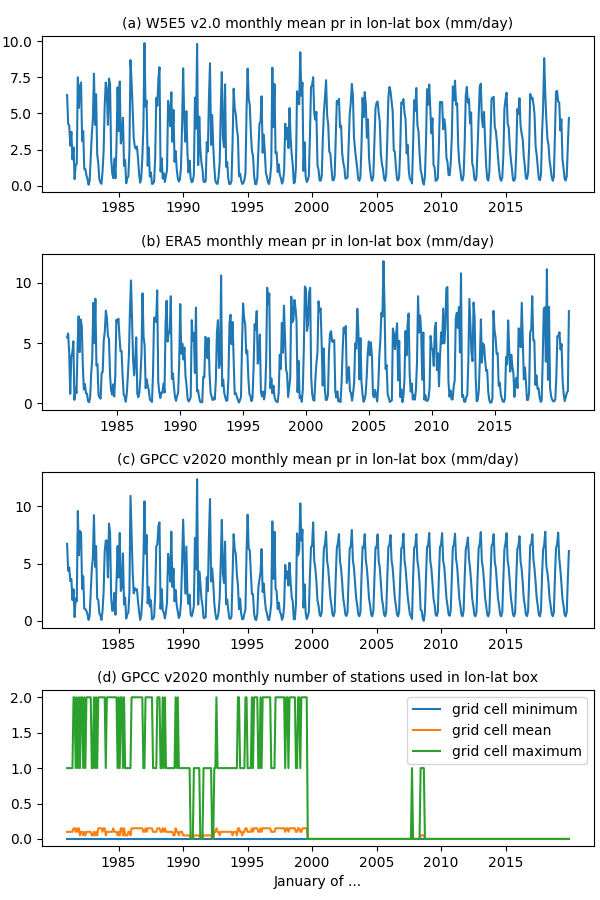
To begin with the examples, Figure 1 shows 1981-2019 time series of monthly mean precipitation (pr) averaged over a longitude-latitude box over Timor Leste (125-127.5°W, 8-10°S) for W5E5, ERA5, and GPCC (panels a-c). Panel (d) shows the monthly number of stations with available data that were used for the production of GPCC in that region. In 1999, this number drops to zero and remains there for most of the following years. As a result, climatologies are used for gap filling in GPCC (panel c) and W5E5 has lower interannual variability than ERA5 (compare panels a and b). The time series of GPCC and W5E5 are not identical because the longitude-latitude box used here includes ocean grid cells, where W5E5 has data while GPCC does not.
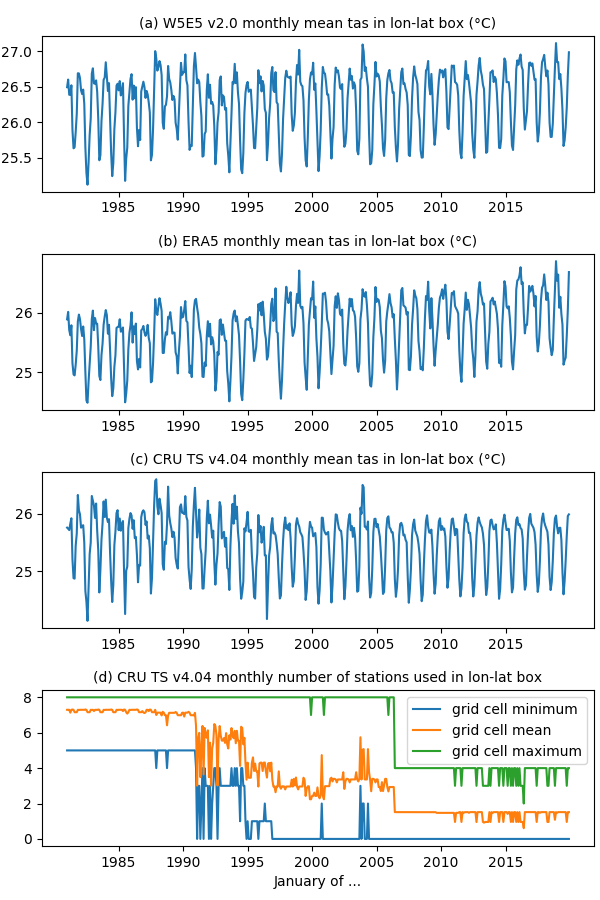
Figure 2 illustrates the problem for daily mean near-surface air temperature (tas) over Papua New Guinea (140-156°W, 2-10°S). In this case, the number of stations used for the production of CRU tas goes to zero only in some of the grid cells of the region starting in 1991. Nevertheless, this has a detrimental impact on the interannual variability and trend of regional mean temperature. Differences between CRU and W5E5 are again due to ocean grid cells included in the longitude-latitude box used.
Figure 3 illustrates the problem for the monthly mean diurnal range of near-surface air temperature (tasmax-tasmin) over parts of Brazil (41-55°E, 5-20°S). Here, observation gaps at the stations used for the production of CRU tasmax-tasmin are present most of the time. Consequently, climatological infilling dominates the CRU and W5E5 time series and they do not reflect the variations visible in ERA5.
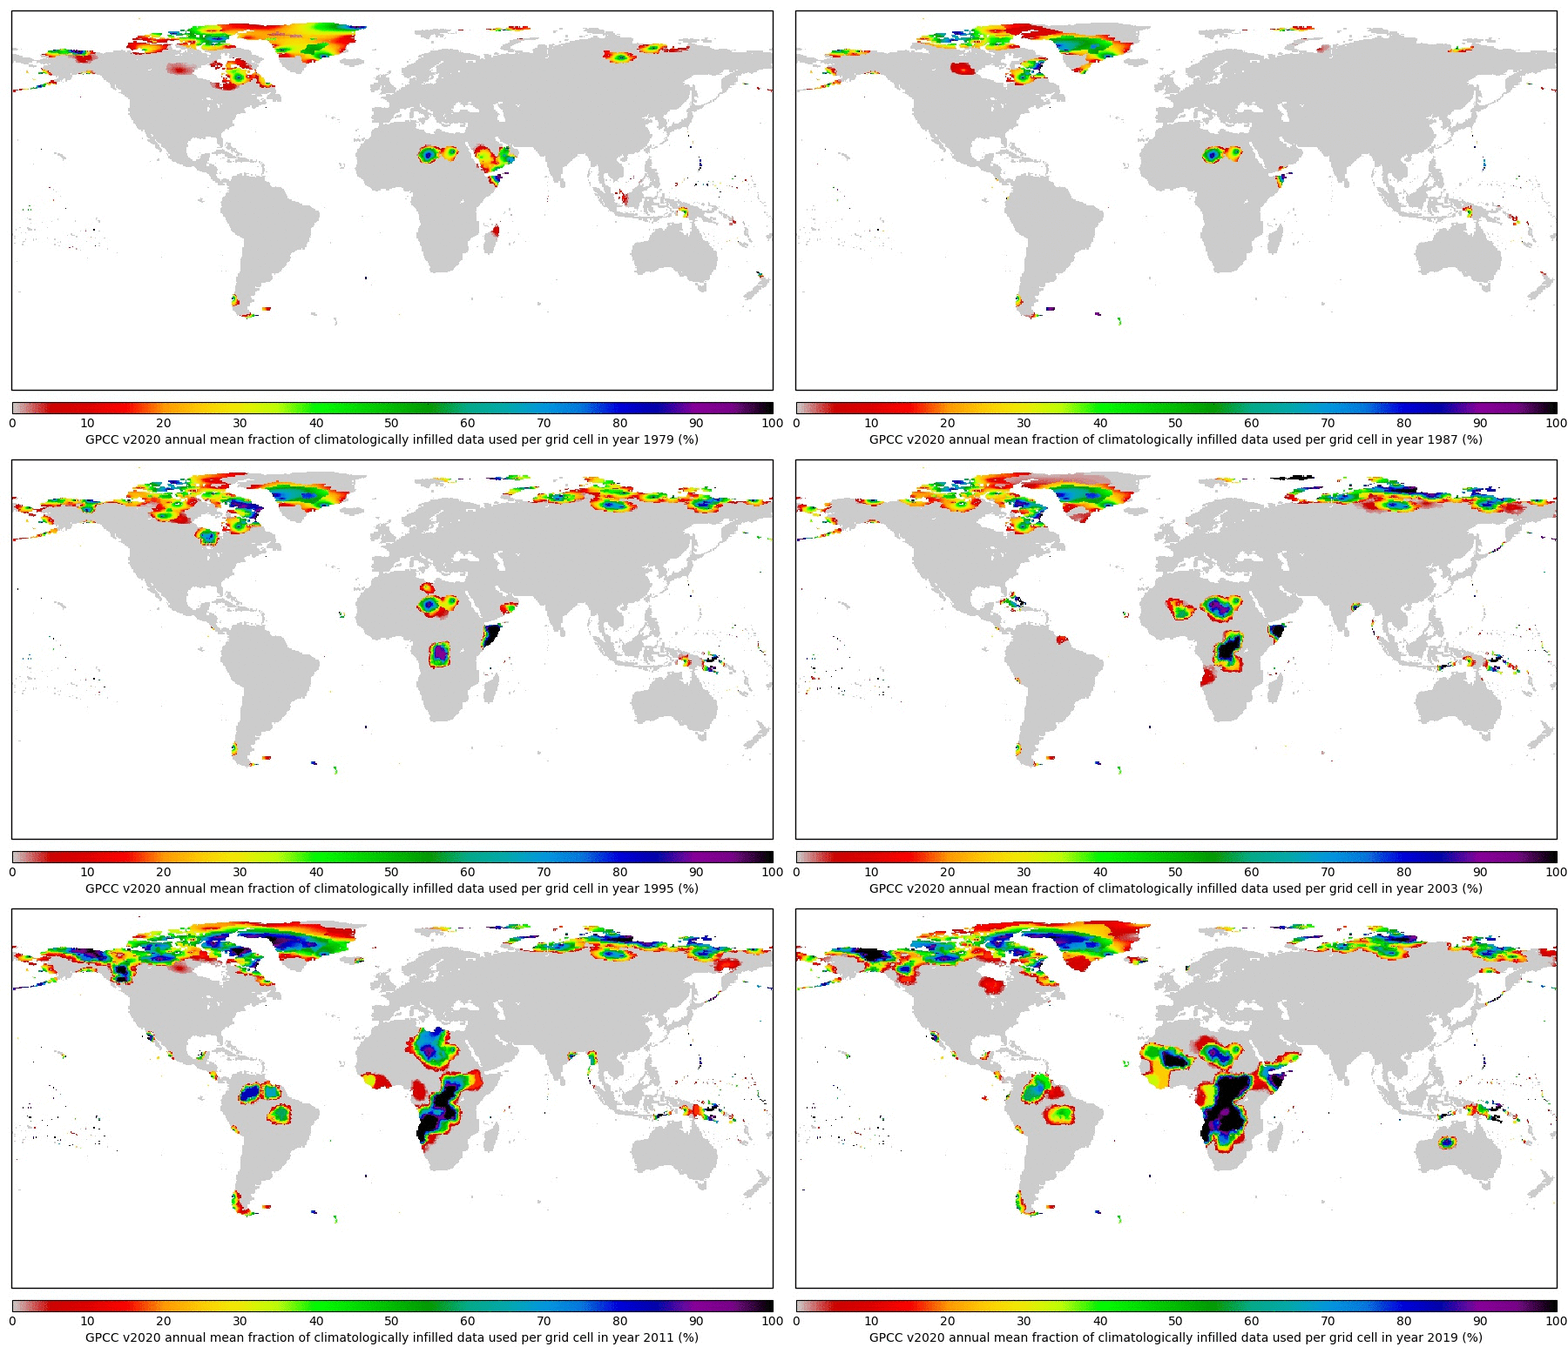
In order to illustrate the extent of the problem for precipitation, global maps of the annual mean fraction of climatologically infilled data used for the production of GPCC v2020 is shown in Figure 4. In most regions, this fraction increases over time. Towards the end of the 1979-2019 period, infilling affects large parts of the tropics, subtropics and high latitudes.
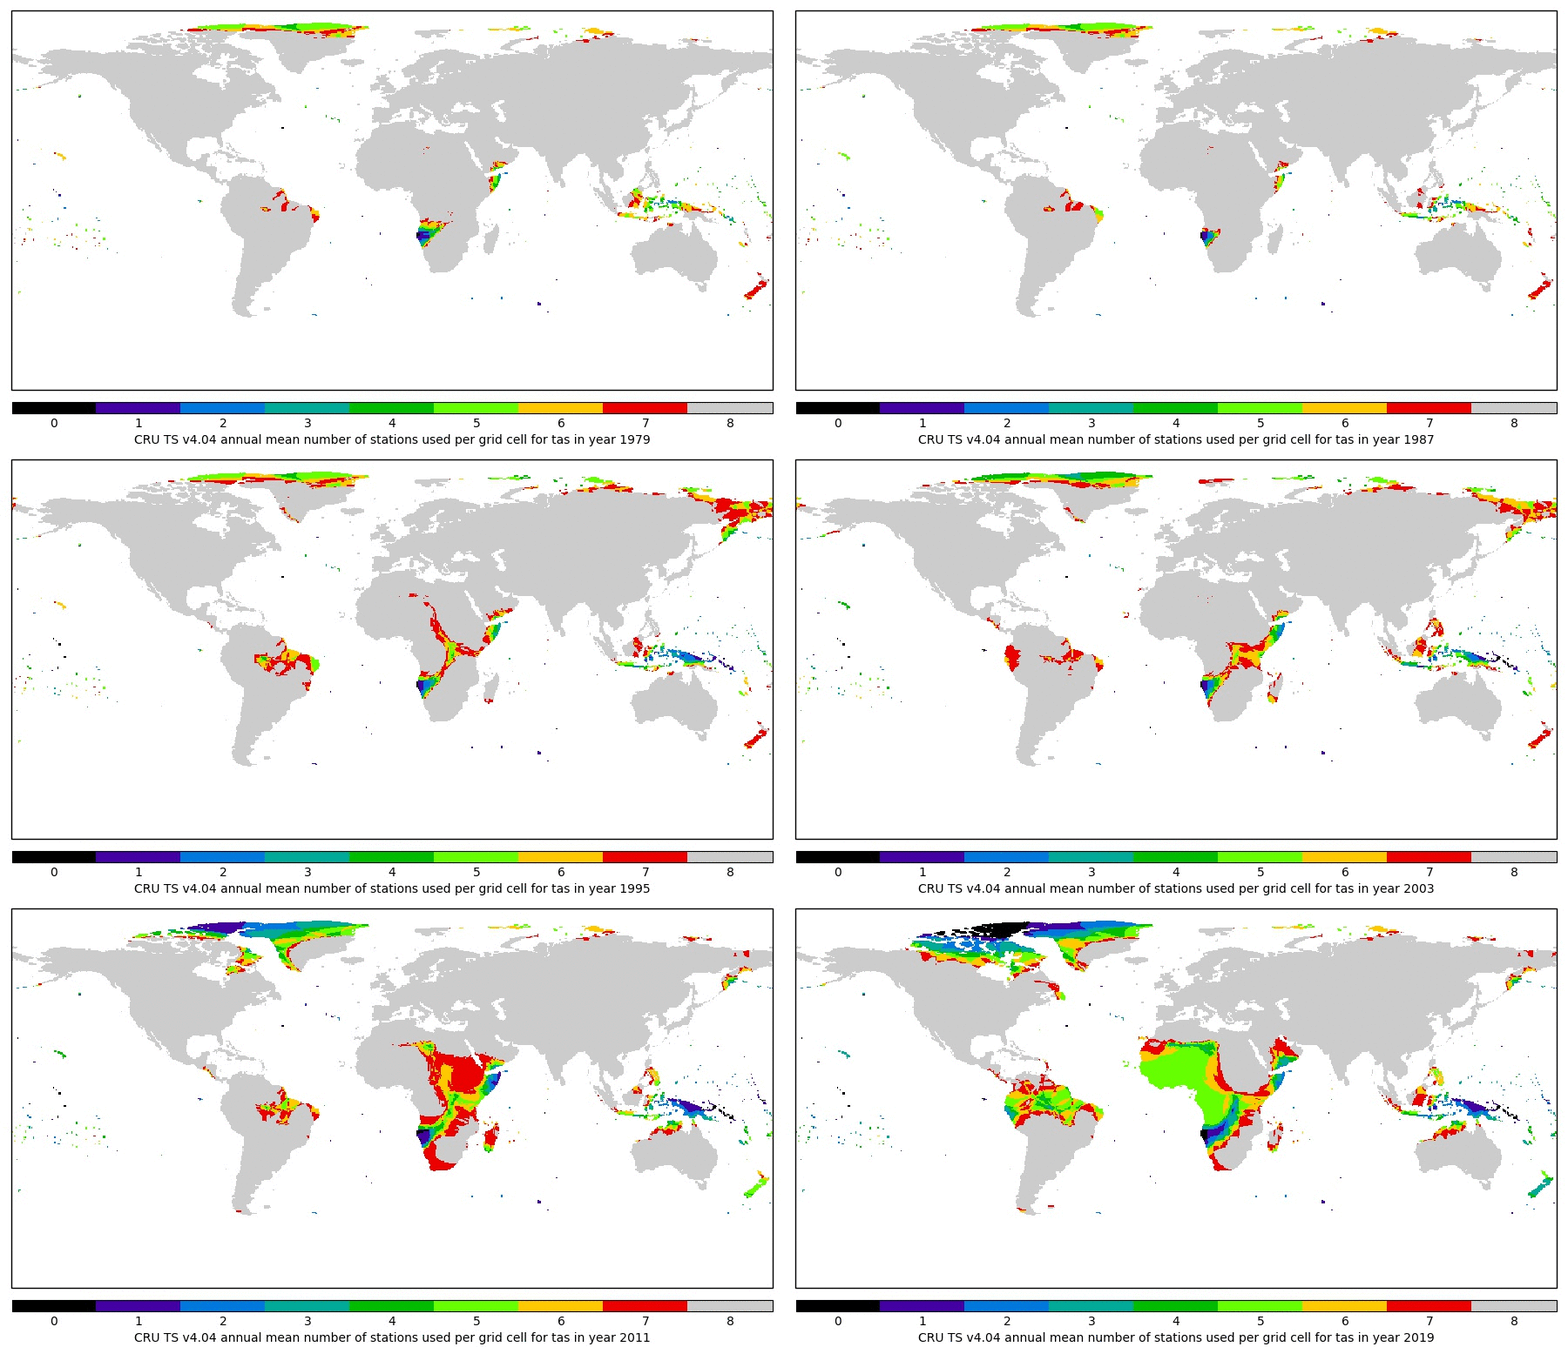
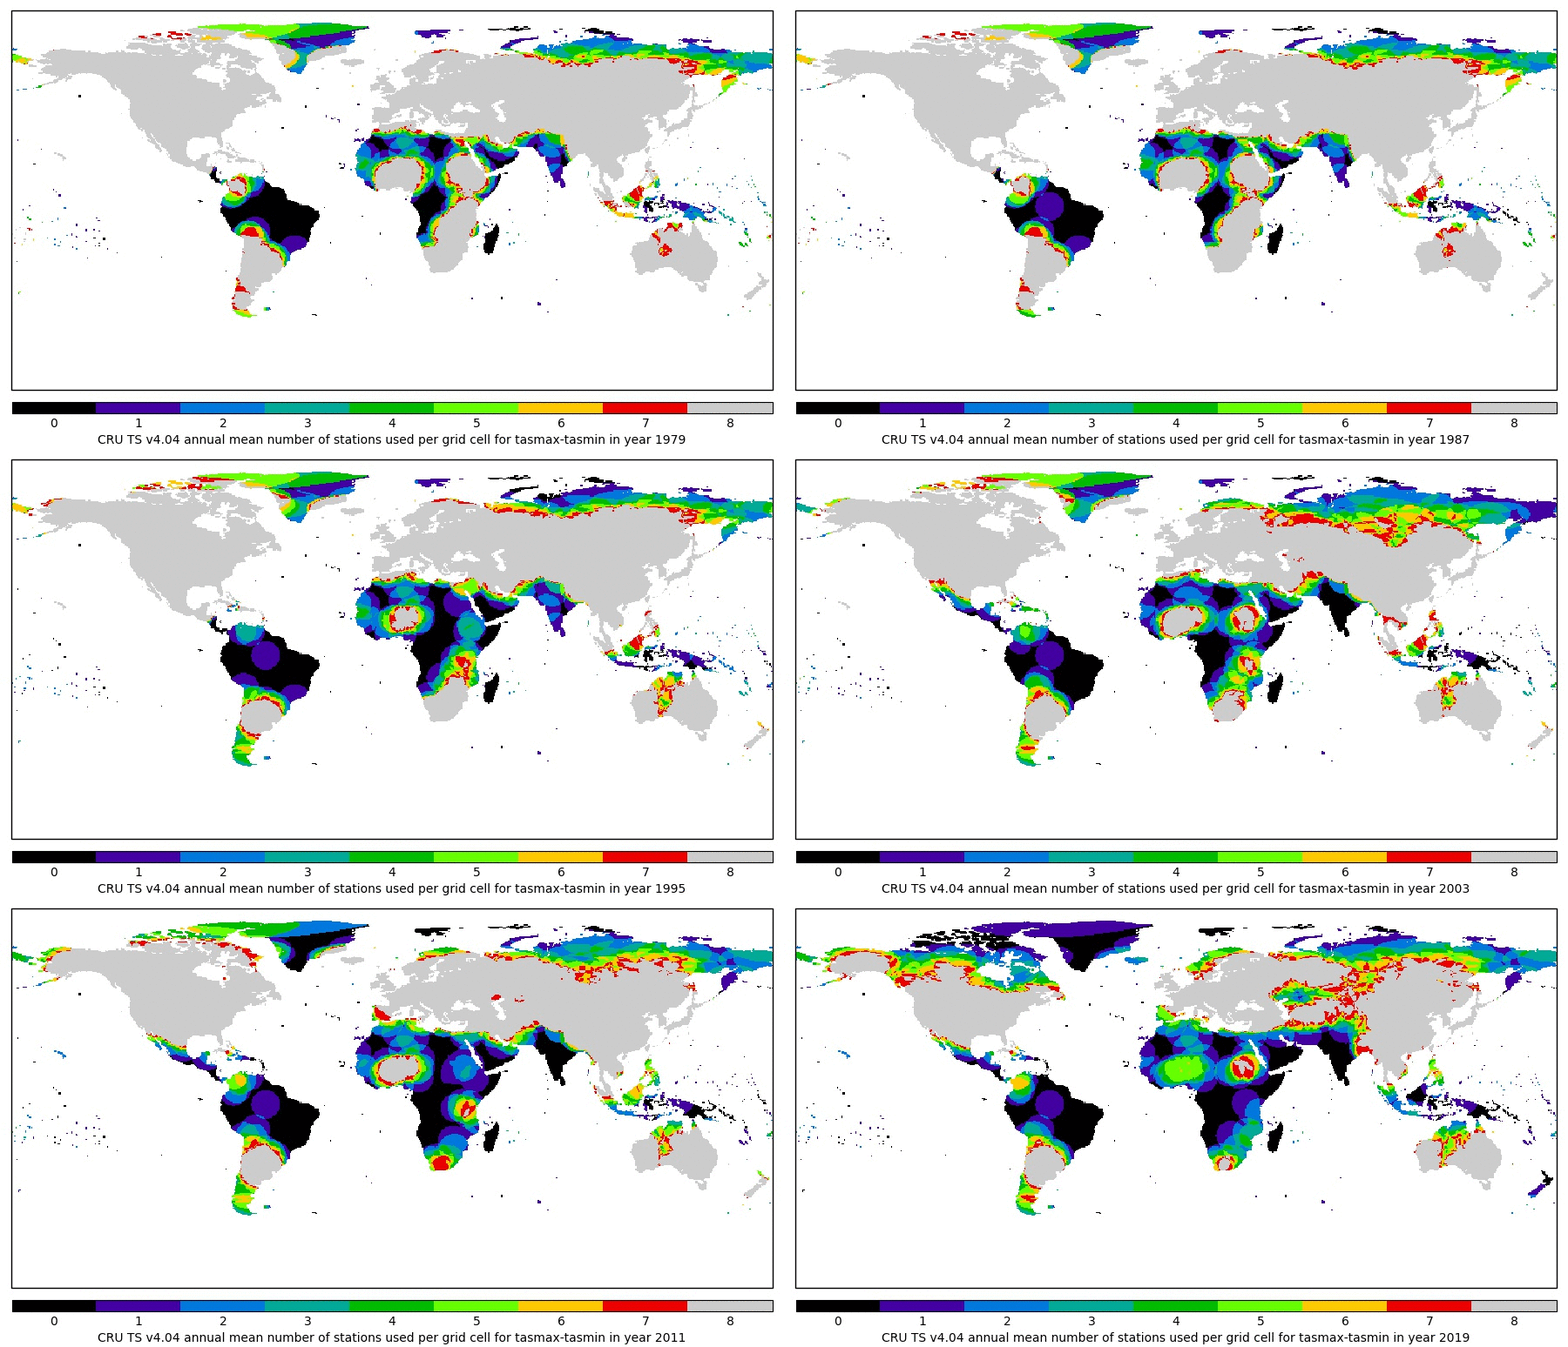
Global maps of the annual mean number of stations used for the production of CRU TS v4.04 tas and tasmax-tasmin are presented in Figures 5 and 6, respectively. Since CRU temperatures are interpolated from at most 8 stations, only station numbers below 8 indicate data scarcity. For tas, most of those cases occur at high latitudes and in the tropics. For tasmax-tasmin, the problem is more widespread, affecting parts of the subtropics and mid-latitudes as well, due to both fewer stations that report the diurnal temperature range and a lower correlation decay distances used for its spatial interpolation in CRU compared to the daily mean temperature [3, Supplementary File 1].
[1] Schneider et al. (2018) http://dx.doi.org/10.5676/DWD_GPCC/FD_M_V2018_050
[2] Schneider et al. (2020) http://dx.doi.org/10.5676/DWD_GPCC/FD_M_V2020_050
[3] Harris et al. (2020) https://doi.org/10.1038/s41597-020-0453-3
[4] Hersbach et al. (2020) https://doi.org/10.1002/qj.3803
[5] Cucchi et al. (2020) https://doi.org/10.5194/essd-12-2097-2020
[6] Lange et al. (2021) https://doi.org/10.48364/ISIMIP.342217
Stefan Lange commented on June 27, 2022.
The ISIMIP3a climate input datasets 20CRV3 and 20CRV3-ERA5 are based on reanalysis data only and hence do not suffer from this kind of gap filling. If you think the above problem influences your results, we suggest you include these reanalysis-only-based forcing datasets in your analysis.
Details
Affected datasets can still be used for simulations or research.
Severity low
Status won't fix
- Versions
- all versions affected
- Input category
- Climate related forcing
- Climate forcing
- 20CRv3-W5E5, CHELSA-W5E5v1.0, GSWP3-W5E5, W5E5v1.0, W5E5v2.0
- Climate variable
- pr, prsn, tas, tasmax, tasmin
- Simulation round
- ISIMIP3a
Affected datasets
There are 110 datasets affected by this issue. Here we only display the first 100 datasets. You can download a complete list of all the datasets, or files affected by this issue as JSON. Alternatively, can also download a list the files as a flat file suitable for Wget. You can use the search interface to further restrict your query.
-
ISIMIP3a InputData climate 20crv3-w5e5 20220517
-
ISIMIP3a InputData climate 20crv3-w5e5 20220517
-
ISIMIP3a InputData climate 20crv3-w5e5 20220517
-
ISIMIP3a InputData climate 20crv3-w5e5 20220517
-
ISIMIP3a InputData climate gswp3-w5e5 Archived 20200624
-
ISIMIP3a InputData climate gswp3-w5e5 20220506
-
ISIMIP3a InputData climate gswp3-w5e5 Archived 20210126
-
ISIMIP3a InputData climate gswp3-w5e5 Archived 20200615
-
ISIMIP3a InputData climate gswp3-w5e5 Archived 20211021
-
ISIMIP3a InputData climate gswp3-w5e5 Archived 20200615
-
ISIMIP3a InputData climate gswp3-w5e5 Archived 20211021
-
ISIMIP3a InputData climate gswp3-w5e5 20220506
-
ISIMIP3a InputData climate gswp3-w5e5 Archived 20200624
-
ISIMIP3a InputData climate gswp3-w5e5 Archived 20210126
-
ISIMIP3a InputData climate gswp3-w5e5 20220506
-
ISIMIP3a InputData climate gswp3-w5e5 Archived 20200624
-
ISIMIP3a InputData climate gswp3-w5e5 Archived 20210126
-
ISIMIP3a InputData climate gswp3-w5e5 Archived 20200615
-
ISIMIP3a InputData climate gswp3-w5e5 Archived 20211021
-
ISIMIP3a InputData climate gswp3-w5e5 Archived 20210126
-
ISIMIP3a InputData climate gswp3-w5e5 Archived 20211021
-
ISIMIP3a InputData climate gswp3-w5e5 Archived 20200615
-
ISIMIP3a InputData climate gswp3-w5e5 Archived 20200624
-
ISIMIP3a InputData climate gswp3-w5e5 20220506
-
ISIMIP3a InputData climate 20crv3-w5e5 20220516
-
ISIMIP3a InputData climate 20crv3-w5e5 20220516
-
ISIMIP3a InputData climate 20crv3-w5e5 20220516
-
ISIMIP3a InputData climate 20crv3-w5e5 20220516
-
ISIMIP3a InputData climate chelsa-w5e5 historical 20220121
-
ISIMIP3a InputData climate chelsa-w5e5 historical 20220330
-
ISIMIP3a InputData climate chelsa-w5e5 historical 20211111
-
ISIMIP3a InputData climate chelsa-w5e5 historical Archived 20220121
-
ISIMIP3a InputData climate chelsa-w5e5 historical 20220121
-
ISIMIP3a InputData climate chelsa-w5e5 historical 20220121
-
ISIMIP3a InputData climate chelsa-w5e5 historical 20220330
-
ISIMIP3a InputData climate chelsa-w5e5 historical Archived 20211111
-
ISIMIP3a InputData climate chelsa-w5e5 historical 20211213
-
ISIMIP3a InputData climate chelsa-w5e5 historical Archived 20220121
-
ISIMIP3a InputData climate chelsa-w5e5 historical 20220121
-
ISIMIP3a InputData climate gswp3-w5e5 Archived 20200624
-
ISIMIP3a InputData climate gswp3-w5e5 20211021
-
ISIMIP3a InputData climate gswp3-w5e5 Archived 20200615
-
ISIMIP3a InputData climate gswp3-w5e5 Archived 20211021
-
ISIMIP3a InputData climate gswp3-w5e5 20221024
-
ISIMIP3a InputData climate gswp3-w5e5 Archived 20200624
-
ISIMIP3a InputData climate gswp3-w5e5 20211021
-
ISIMIP3a InputData climate gswp3-w5e5 Archived 20200615
-
ISIMIP3a InputData climate gswp3-w5e5 20211021
-
ISIMIP3a InputData climate gswp3-w5e5 Archived 20200615
-
ISIMIP3a InputData climate gswp3-w5e5 Archived 20200624
-
ISIMIP3a InputData climate gswp3-w5e5 Archived 20200615
-
ISIMIP3a InputData climate gswp3-w5e5 Archived 20200624
-
ISIMIP3a InputData climate gswp3-w5e5 20211021
-
ISIMIP3a InputData climate 20crv3-w5e5 20220517
-
ISIMIP3a InputData climate 20crv3-w5e5 20220517
-
ISIMIP3a InputData climate 20crv3-w5e5 20220517
-
ISIMIP3a InputData climate 20crv3-w5e5 20220517
-
ISIMIP3a InputData climate gswp3-w5e5 Archived 20210127
-
ISIMIP3a InputData climate gswp3-w5e5 20220506
-
ISIMIP3a InputData climate gswp3-w5e5 Archived 20211021
-
ISIMIP3a InputData climate gswp3-w5e5 Archived 20200624
-
ISIMIP3a InputData climate gswp3-w5e5 Archived 20200615
-
ISIMIP3a InputData climate gswp3-w5e5 Archived 20200624
-
ISIMIP3a InputData climate gswp3-w5e5 Archived 20200615
-
ISIMIP3a InputData climate gswp3-w5e5 Archived 20210127
-
ISIMIP3a InputData climate gswp3-w5e5 20220506
-
ISIMIP3a InputData climate gswp3-w5e5 Archived 20211021
-
ISIMIP3a InputData climate gswp3-w5e5 Archived 20210127
-
ISIMIP3a InputData climate gswp3-w5e5 Archived 20200624
-
ISIMIP3a InputData climate gswp3-w5e5 20220506
-
ISIMIP3a InputData climate gswp3-w5e5 Archived 20200615
-
ISIMIP3a InputData climate gswp3-w5e5 Archived 20211021
-
ISIMIP3a InputData climate gswp3-w5e5 Archived 20210127
-
ISIMIP3a InputData climate gswp3-w5e5 Archived 20211021
-
ISIMIP3a InputData climate gswp3-w5e5 Archived 20200615
-
ISIMIP3a InputData climate gswp3-w5e5 Archived 20200624
-
ISIMIP3a InputData climate gswp3-w5e5 20220506
-
ISIMIP3a InputData climate 20crv3-w5e5 20220517
-
ISIMIP3a InputData climate 20crv3-w5e5 20220517
-
ISIMIP3a InputData climate 20crv3-w5e5 20220517
-
ISIMIP3a InputData climate 20crv3-w5e5 20220517
-
ISIMIP3a InputData climate gswp3-w5e5 Archived 20220119
-
ISIMIP3a InputData climate gswp3-w5e5 20220506
-
ISIMIP3a InputData climate gswp3-w5e5 20220506
-
ISIMIP3a InputData climate gswp3-w5e5 Archived 20220119
-
ISIMIP3a InputData climate gswp3-w5e5 20220506
-
ISIMIP3a InputData climate gswp3-w5e5 Archived 20220119
-
ISIMIP3a InputData climate gswp3-w5e5 20220506
-
ISIMIP3a InputData climate gswp3-w5e5 Archived 20220119
